The short answer
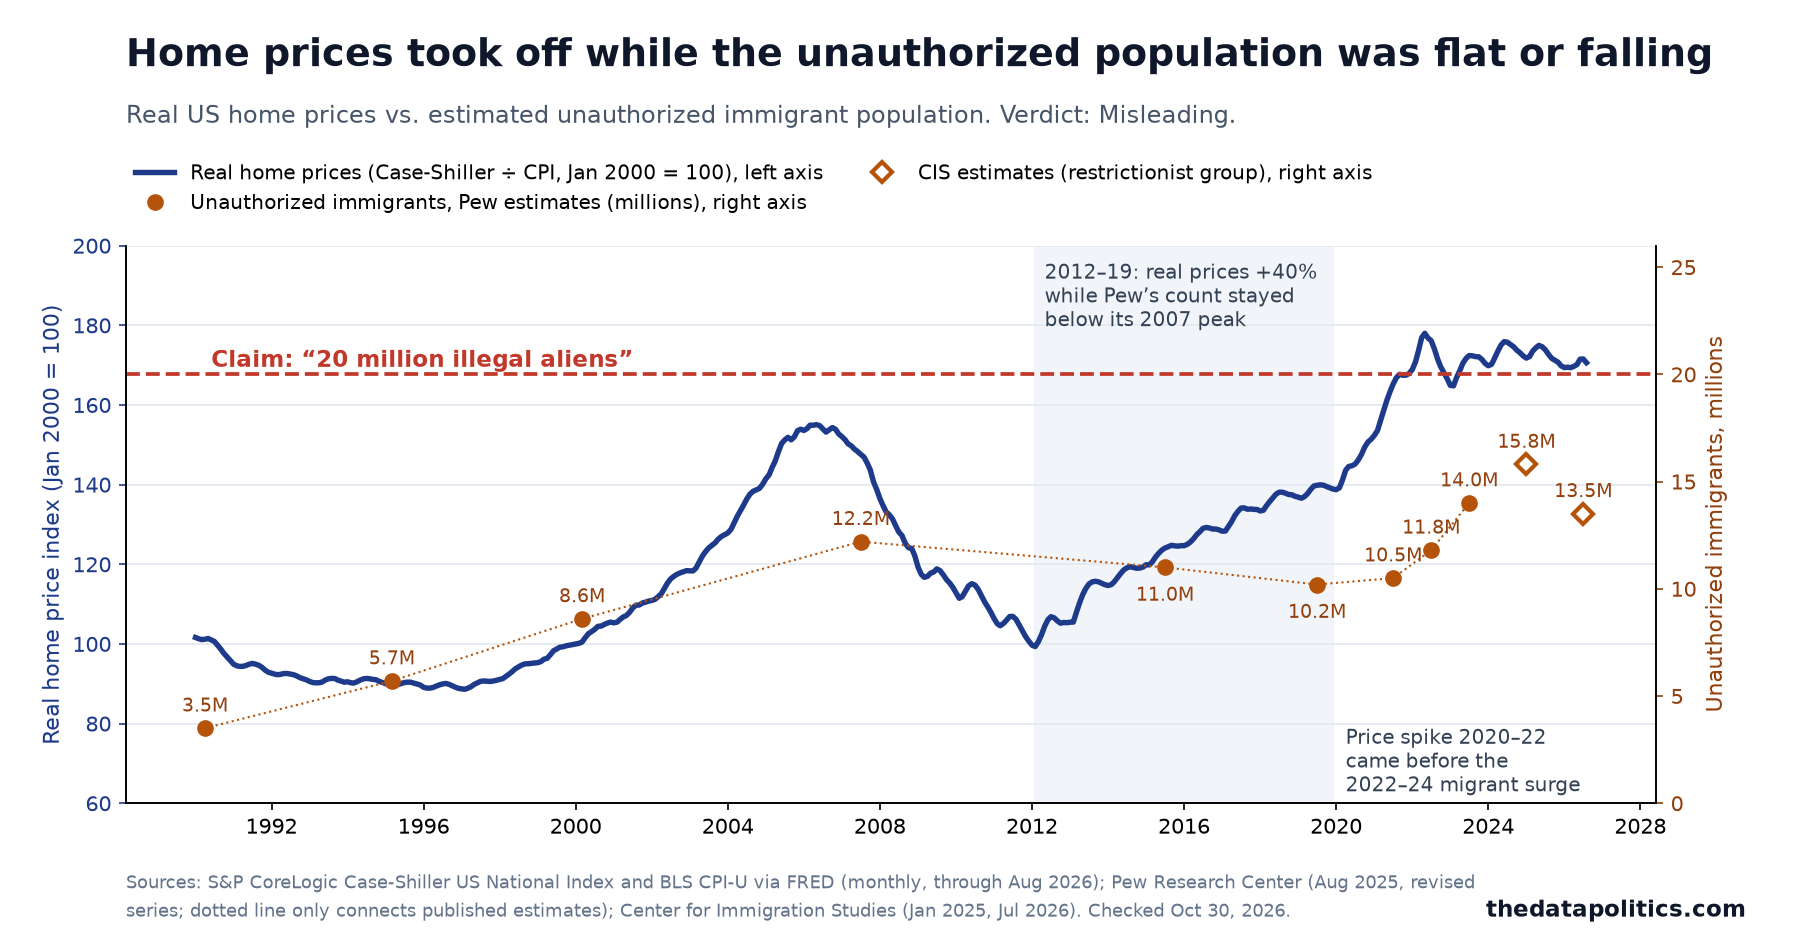
Housing did explode, and immigration is part of the story, so two pieces of the claim hold up. The rest doesn’t. After inflation, home prices rose 40% from 2012 to 2019, a stretch when the unauthorized population was below its 2007 peak and falling. The sharpest spike, in 2020–22, came before the big migrant surge of 2022–24. And most unauthorized immigrants rent: about 31% live in a home their household owns.
The 20 million figure is at the high end. It is above Pew, the Migration Policy Institute and even the Center for Immigration Studies, a group that favors less immigration. Only one academic model is higher. Vance gave no time frame and no source for the number; this page checks it against estimates of everyone living here without legal status.
Row by row
| The claim | What the data shows | Verdict |
|---|---|---|
| “Housing exploded” | After inflation, the Case-Shiller national home price index rose 40% from its Feb 2012 low to Dec 2019, then another 28% to its May 2022 peak (Case-Shiller ÷ CPI). Against median household income, prices went from 113 in 2019 to 145 in 2022 (2000 = 100; FHFA index ÷ Census income). In Aug 2026, real prices were 4% below the 2022 peak and still 10% above the 2006 bubble peak. | Claim right Prices did explode, and they have not come back down. |
| “20 million illegal aliens” | Pew: 14.0 million in 2023, a record (Pew). The Migration Policy Institute: 13.7 million in 2023 (MPI). The Center for Immigration Studies, which favors less immigration: 15.8 million in Jan 2025, down to 13.5 million in Jul 2026 (CIS 2025, CIS 2026). One peer-reviewed 2018 model from Yale and MIT researchers estimated 22.1 million as of 2016, with a range of 16.2 to 29.5 million (PLOS One). CIS calls 20 to 30 million “too high.” | High end Not baseless: one serious study is above it. But it is above every mainstream count, including the one from the group most skeptical of immigration. |
| “In part because” of immigration | Long run: a Bank of Canada study of US counties, 1985–2019, puts immigration’s share of US shelter price growth at about 2% (BoC SWP 2024-40). The 2021–24 surge: a Dallas Fed paper finds each 1% of local employment added by unauthorized workers raised house prices 2.2%. In the typical (median) metro, that raised prices about 2.9%, roughly 13% of its price growth from Mar 2021 to Mar 2024. In big, high-inflow metros it was much larger: about 30% of price growth in the employment-weighted average metro (Dallas Fed WP 2607). A Brookings paper finds the surge raised rents 1.4% to 1.6% (BPEA). Timing: the 2020–21 price spike came before the 2022–23 immigration surge (Harvard JCHS). | Partly right Immigration is a real part, and the Dallas Fed finding is the strongest evidence for his side. But it is concentrated in 2021–24 and in big metros, and it is small over the long run. |
| “To buy homes” | About 4.3 million unauthorized immigrants (31%) live in a home their household owns (MPI, mid-2023). That is people, not homes; many share one house. The other 7 in 10 live in rented homes. For scale, the US has 87.7 million owner-occupied homes (Census HVS, Q3 2026). | Misleading Most unauthorized immigrants rent. Where they add demand, it is mainly for rentals, not homes for sale. |
| What actually drove it | Underbuilding: from 2008 to 2019, the US completed 0.88 new homes per new household, versus 1.10 in 1970–2007 (1.20 in the 1990s, 1.13 in 2000–07) (Census completions, CPS households). Shortage estimates run from 3.7 to 5.5 million homes. Remote work: one model-based paper finds it explains more than half of the 18.9% real rise from 2019 to 2023 (NBER w30041). Rate lock-in: owners holding cheap mortgages stopped selling; FHFA estimates that raised prices 5.7%, more than offsetting the 3.3% drag from higher rates (FHFA WP 24-03). Enforcement cuts both ways: the Secure Communities deportation program cut homebuilding 5.7% and raised new-home prices 4.4% in counties where it took effect (Howard, Wang & Zhang). | Context Not a verdict on Vance. The biggest driver is a decade of building too little, then a pandemic demand shock hitting that thin supply. |
Scorecard: right that housing exploded and that immigration played a part. The 20 million is at the high end of the estimates. “To buy homes” is misleading: about 7 in 10 rent, and prices rose fastest in years when the unauthorized population was not growing.
How short is the US on homes?
Every major estimate finds a shortage in the millions. The methods differ, so the numbers do too, but none is close to zero.
| Source | Homes short | As of |
|---|---|---|
| Freddie Mac | 3.7M | Q3 2024 |
| Up for Growth | 3.8M | 2023 |
| Zillow | 4.7M | 2023 |
| Brookings | 4.9M | Q4 2023 |
| NAR / Rosen Consulting | 5.5M | 2020 |
His other target: Wall Street and foreign buyers
In the same answer, Vance also blamed Wall Street and foreign investors. Both are real but small nationally. The five largest institutional investors owned nearly 2% of single-family rental homes at the end of 2022, but investors with more than 1,000 homes held about 25% of Atlanta’s single-family rentals, a share GAO says may be overstated (GAO-24-106643). Foreign buyers bought 67,100 existing homes from April 2025 to March 2026, 1.7% of sales, and 56% of them already lived in the US (NAR). This page does not rate that part of his answer.
The accurate version
“About 14 million people live here without legal status. The 2021–24 surge pushed up rents and prices, most of all in the big cities where migrants settled. But the main reason housing costs so much is that we built too few homes for a decade after 2008.” Every part of that can be checked, and the record backs it.
The takeaway
Both sides have a convenient story about housing, and the data fits neither. To one side, migrants priced Americans out. But real prices climbed 40% from 2012 to 2019, years when the unauthorized population was smaller than in 2007 and shrinking, and about 7 in 10 unauthorized immigrants rent. To the other side, immigration has nothing to do with it. But the Dallas Fed finds the 2021–24 surge accounts for roughly 30% of price growth in the average metro, concentrated in the big cities where migrants settled. What both stories skip is the plain one: from 2008 to 2019 the country finished 0.88 homes for every new household, down from 1.10 over 1970–2007. Then a pandemic sent millions looking for more space in a market with nothing to spare. Deport everyone and the shortage remains; a study of the Secure Communities deportation program found it cut homebuilding. Add people without adding homes and the shortage deepens. Prices come down only when we build.
“0.88 homes per new household” is total housing completions, 2008–19 (Census, via FRED COMPUTSA), divided by the increase in households over the same years (Census CPS, via FRED TTLHH). The 1970–2007 average was 1.10. Completions include replacements for demolished homes, so a healthy ratio is above 1.
Method and caveats
- What is checked. Vance gave no time frame and did not say how the 20 million was counted. We compare it with estimates of the whole unauthorized population at any one time, the most generous reading for the claim. Counts of border encounters are events, not people, and are not used.
- Real prices are the Case-Shiller US National Index (not seasonally adjusted) divided by CPI-U, through Aug 2026. The 40% is the Feb 2012 low to Dec 2019; using annual averages, 2012 to 2019 is +33%. Price-to-income uses FHFA’s all-transactions index (annual average) divided by Census median household income, scaled to 2000 = 100.
- Unauthorized population. Pew’s revised series (Aug 2025) supersedes its earlier estimates; its labeled points are used as published. Pew, MPI and CIS all count people with temporary protection from deportation, such as asylum applicants and parolees. The CIS figures use the monthly CPS and are not directly comparable with Pew’s ACS-based ones.
- Immigration effects. The Dallas Fed and Brookings papers compare metro areas with more and fewer arrivals; national effects can differ. The Dallas Fed’s 30% is for the employment-weighted average metro, Mar 2021 to Mar 2024; for the median metro it is about 13%. The Bank of Canada’s 2% covers 1985–2019, before the surge.
- Homeownership. MPI’s 31% counts unauthorized immigrants living in homes that are owned rather than rented. It does not say who holds the title.
- Remote work. The NBER estimate comes from one model-based paper; it is a leading estimate, not a consensus figure.
- Completions per household uses the CPS household series, which jumps in some years (for example 2001) because of survey reweighting; multi-year averages smooth this.
Sources
- The claim: @VP on X, Oct 29, 2026 (clip from a Fox News town hall). Quoted verbatim.
- Prices and income (FRED): Case-Shiller US National, CSUSHPINSA; CPI-U, CPIAUCSL; FHFA all-transactions index, USSTHPI; median household income, MEHOINUSA646N.
- Supply (FRED): housing completions, COMPUTSA; total households, TTLHH; owner-occupied homes, EOWNOCCUSQ176N.
- Unauthorized population: Pew Research Center (Aug 2025); Migration Policy Institute fact sheet (2025); CIS, Jan 2025 and CIS, Jul 2026; Fazel-Zarandi, Feinstein & Kaplan, PLOS One (2018).
- Immigration and housing: Cabral & Steingress, Bank of Canada SWP 2024-40; Wilson & Zhou, Dallas Fed WP 2607 (Mar 2026); Hunt, Orrenius & Zavodny, Brookings BPEA (fall 2026); Harvard Joint Center for Housing Studies (Oct 2024).
- Other drivers: Mondragon & Wieland, NBER w30041; Batzer et al., FHFA WP 24-03; Howard, Wang & Zhang, SSRN 4729511.
- Shortage estimates: Freddie Mac; Up for Growth; Zillow; Brookings; NAR/Rosen via CRS IN12628.
- Investors and foreign buyers: GAO-24-106643; NAR 2026 International Transactions.
Data checked Oct 30, 2026. Only the quoted sentence is attributed to Vance.