The short version
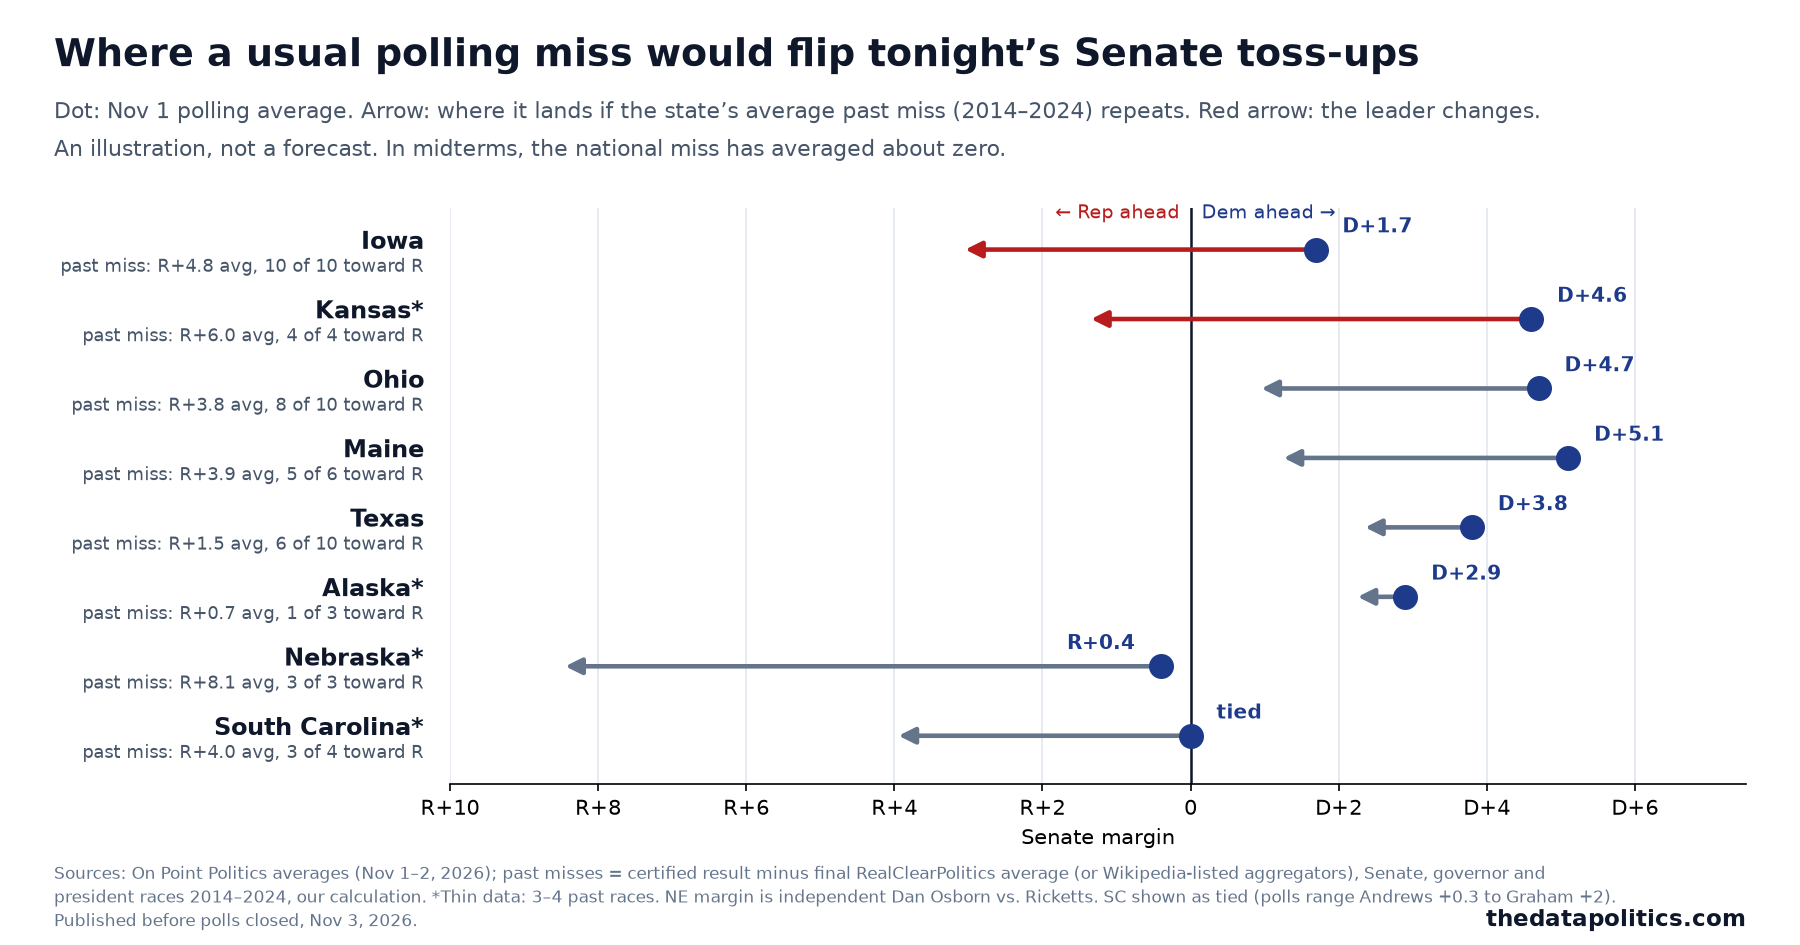
From 2014 to 2024, polls underestimated Republicans in 30 of the 33 races we checked in Iowa, Kansas, Ohio, Maine and Nebraska. Four of those states hold Senate toss-ups tonight, and Democrats lead the polling average in all four. If each state misses by its usual amount, Iowa and Kansas flip to the Republican, and Ohio and Maine get close but stay Democratic.
The other side of the record matters as much. In midterms, polling misses have averaged about zero across the competitive races we checked. In 2022, polls underestimated Democrats in 11 of 14 competitive races. Over the whole period, the year mattered more than the state: misses mostly moved in the same direction everywhere at once.
The test
A miss here means the certified margin minus the final polling average. We compare tonight’s results with the Nov 1 averages in the table below.
Outcome A: the state pattern repeats
Results in Iowa, Kansas, Ohio, Maine and Nebraska come in more Republican than their polling averages, by about their usual 4 to 8 points. Iowa and Kansas are where a normal-sized miss changes the winner. Ohio, Maine, Texas and Alaska would need a bigger miss than their history shows.
Proves it wrong: three or more of those five states come in at or to the Democratic side of their Nov 1 average.
Outcome B: 2026 behaves like 2018 and 2022
The misses are close to zero or lean toward Democrats, as in the last two midterms. The Democratic leads in the polls hold or grow, including in Iowa and Kansas.
Proves it wrong: most of the eight races in the table come in more Republican than their Nov 1 average.
There is a third possibility. 2014 was a midterm too, and polls underestimated Republicans in 11 of 16 competitive races that year, by 3.0 points on average. A year like that would push every race in the table toward Republicans at once, not just the five states with a history.
We’ll check the results against this page once states certify, and add a dated note at the bottom. We will not change the numbers above.
The races to watch
| State | Race | Cook (Nov 2) | Polling avg (Nov 1) | Avg past miss | Past races missed toward R | If the usual miss repeats |
|---|---|---|---|---|---|---|
| Iowa | Turek (D) vs. Hinson (R), open | Toss Up | Turek +1.7 | R+4.8 | 10 of 10 | R+3.1 (flips) |
| Kansas | Hamilton (D) vs. Marshall (R) | Toss Up | Hamilton +4.6 | R+6.0 | 4 of 4 (thin) | R+1.4 (flips) |
| Ohio | Brown (D) vs. Husted (R), special | Toss Up | Brown +4.7 | R+3.8 | 8 of 10 | D+0.9 |
| Maine | Jackson (D) vs. Collins (R) | Toss Up | Jackson +5.1 | R+3.9 | 5 of 6 | D+1.3 |
| Texas | Talarico (D) vs. Paxton (R), open | Toss Up | Talarico +3.8 | R+1.5 | 6 of 10 | D+2.3 |
| Alaska | Peltola (D) vs. Sullivan (R) | Toss Up | Peltola +2.9 | R+0.7 | 1 of 3 (thin) | D+2.2 |
| Nebraska | Osborn (I) vs. Ricketts (R) | Lean R | Ricketts +0.4 | R+8.1 | 3 of 3 (thin) | R+8.5 |
| South Carolina | Andrews (D) vs. D. Graham (R) | Lean R | About tied* | R+4.0 | 3 of 4 (thin) | R+4.0 |
Averages from On Point Politics. Ratings from Cook Political Report. Sabato’s Crystal Ball rates Iowa Leans R and Kansas, Maine, Ohio, Texas and Alaska Leans D. * South Carolina: On Point lists Andrews +0.3, electoral-vote.com has Graham +2, and the latest NYT/Siena poll was 48–48 (Spectrum News, NYT). We treat it as tied. Past misses cover Senate, governor and presidential races in each state, 2014–2024.
If you count only midterm races, Iowa (R+3.8 over 5 races), Kansas (R+6.7 over 3) and Ohio (R+3.8 over 5) still show a Republican-side history. Maine shrinks to R+1.7 over 3, and Texas to R+0.4 over 5. Elsewhere, Minnesota and New Hampshire have leaned the other way: polls underestimated Democrats in 7 of 11 Minnesota races. Texas, Michigan, North Carolina, Georgia, Pennsylvania, Arizona and Alaska show no stable direction.
The national record
Generic House ballot: final average vs. actual House vote
| Midterm | RCP final | House vote | Miss |
|---|---|---|---|
| 2010 | R+9.4 | R+6.8 | Polls overstated R by 2.6 |
| 2014 | R+2.4 | R+5.7 | Polls understated R by 3.3 |
| 2018 | D+7.3 | D+8.6 | Polls understated D by 1.3 |
| 2022 | R+2.5 | R+2.7 | About right (0.2) |
House vote from the Clerk of the House, via Wikipedia’s cited totals. In 2022, 538’s final average (R+1.2) underestimated Republicans by about 1.5, per a secondary source.
Competitive state races, by year
| Year | Average miss | Underestimated R / D (of) |
|---|---|---|
| 2014 (midterm) | R+3.0 | 11 / 3 (16) |
| 2016 (presidential) | R+2.7 | 11 / 1 (16) |
| 2018 (midterm) | R+0.2 | 4 / 5 (11) |
| 2020 (presidential) | R+3.4 | 16 / 3 (21) |
| 2022 (midterm) | D+3.6 | 2 / 11 (14) |
| 2024 (presidential) | R+2.4 | 13 / 0 (17) |
Average across competitive midterm races: about 0 (41 races). Presidential years: R+2.9 (54 races). Races within 1 point count as neither. “Competitive” means the final polling margin was 10 points or less.
Method and caveats
- What we measured. 125 Senate, governor and presidential races in 16 states, 2014–2024. Miss = certified Republican margin minus the final polling average’s Republican margin. A positive number means polls underestimated the Republican. All 125 rows are downloadable as a CSV.
- Polling averages. RealClearPolitics final averages, read from Wayback Machine copies of each race page saved around Election Day. Where none was available, we used the aggregator averages listed on the race’s Wikipedia page (RCP preferred). Those mixed sources are labeled in the CSV.
- Estimates are labeled. In 6 races with no published average, we took a simple mean of the polls RCP listed in the final 21 days (at least two polls). Another 9 averages began before October. Both are flagged in the CSV.
- Certified results come from Wikipedia’s cited state certification, FEC and House Clerk figures, not election-night counts.
- Thin data. Kansas, Nebraska, South Carolina and Alaska have only 3 or 4 usable races each, because many races there had no polling average. Treat their numbers as weak evidence.
- Independents. Where an independent was the main opponent (Kansas 2014, Alaska 2020, Nebraska 2024 and 2026), we treat them as the Democratic side.
- Different aggregators. The 2026 averages are On Point’s; the history is mostly RCP’s. Averages from different aggregators can differ by a point or two on the same race.
- The “if it repeats” column just subtracts each state’s average past miss from its Nov 1 average. It is an illustration of what history would imply, not a prediction.
Sources
- 2026 polling averages: On Point Politics, Senate averages (updated Nov 1–2, 2026); electoral-vote.com (cross-check).
- 2026 ratings: Cook Political Report Senate ratings (Nov 2, 2026); Sabato’s Crystal Ball final ratings (Nov 2, 2026).
- South Carolina: New York Times (Oct 30, 2026); Spectrum News on the NYT/Siena poll (Nov 2, 2026).
- Generic ballot: RealClearPolitics final averages, 2010, 2014, 2018, 2022 (Wayback Machine). House vote: Clerk of the House election statistics; Wikipedia, 2022 House elections (cited totals).
- State races 2014–2024: RealClearPolitics race pages (Wayback Machine) and Wikipedia race pages; per-race sources are in the CSV.
Data checked Nov 2–3, 2026.
Results check
Pending. We will add the certified margins here, dated, after the results are in.